Report Designer
Intuitive drag & drop designer with advanced reporting components.
Create professional reports and interactive maps from any data source. Design once, publish everywhere with AcuGIS Report Designer and Report Server.
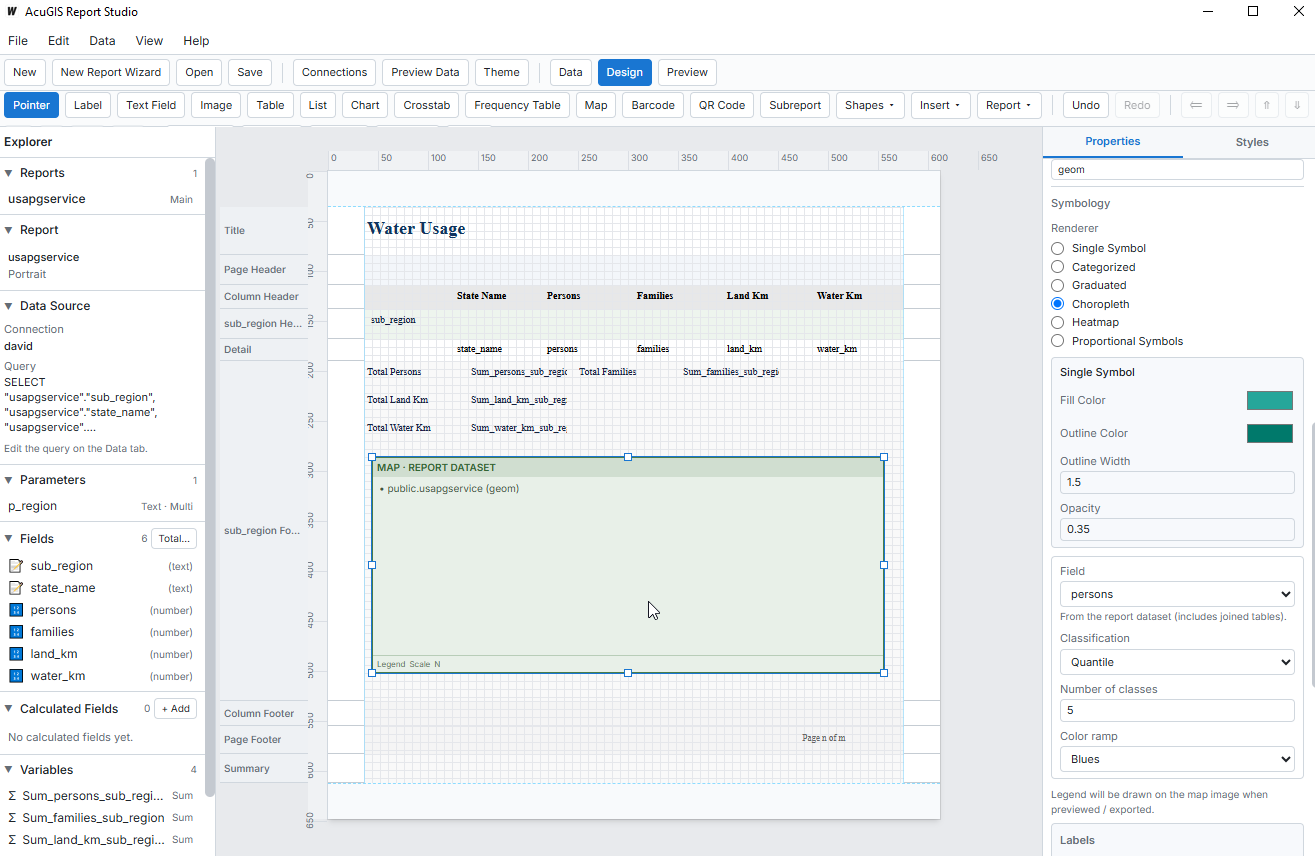
Intuitive drag & drop designer with advanced reporting components.
Create stunning maps with multiple GIS data sources and layers.
Powerful charts, crosstabs, and data visualization components.
Connect to databases, files, web services, and GIS platforms.
Publish reports to the web and share with your organization.
Build interactive dashboards with live data and filters.
Connect to the databases and file formats your organization already uses.















 CSV
 Excel
 JSON
 XML
Work with the GIS servers, standards, and spatial formats you rely on.
Finish in Report Designer, then publish to Report Server in one click. Share secure, browser-based reports and dashboards with your organization.
Work with the GIS servers, standards, and spatial formats you rely on.
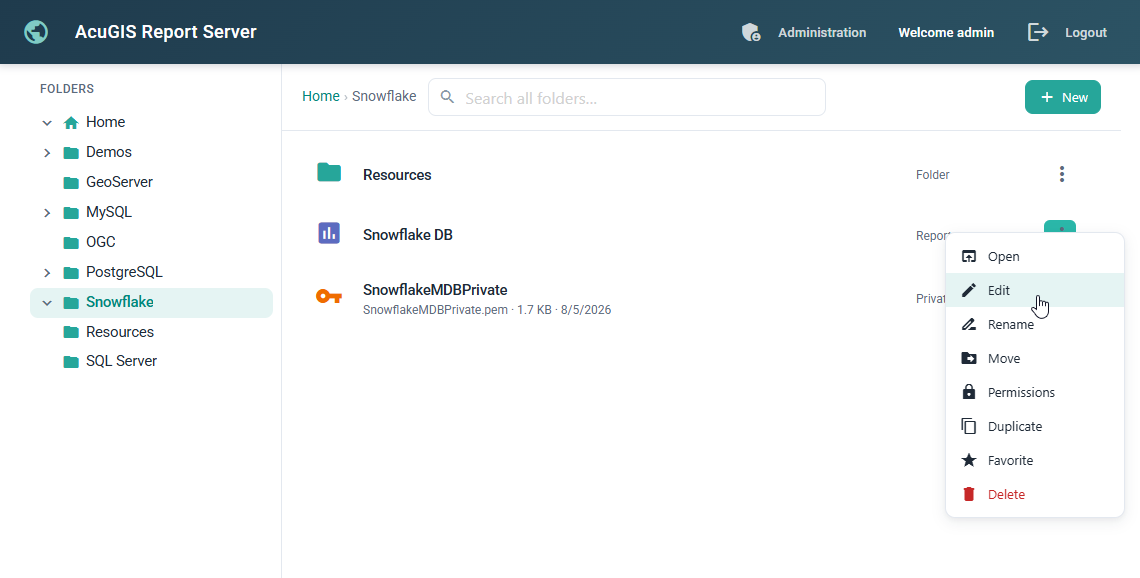
Blend GIS layers, charts, and tabular data in one report. Connect to PostGIS, ArcGIS, GeoServer, and more - then design maps your audience can explore.
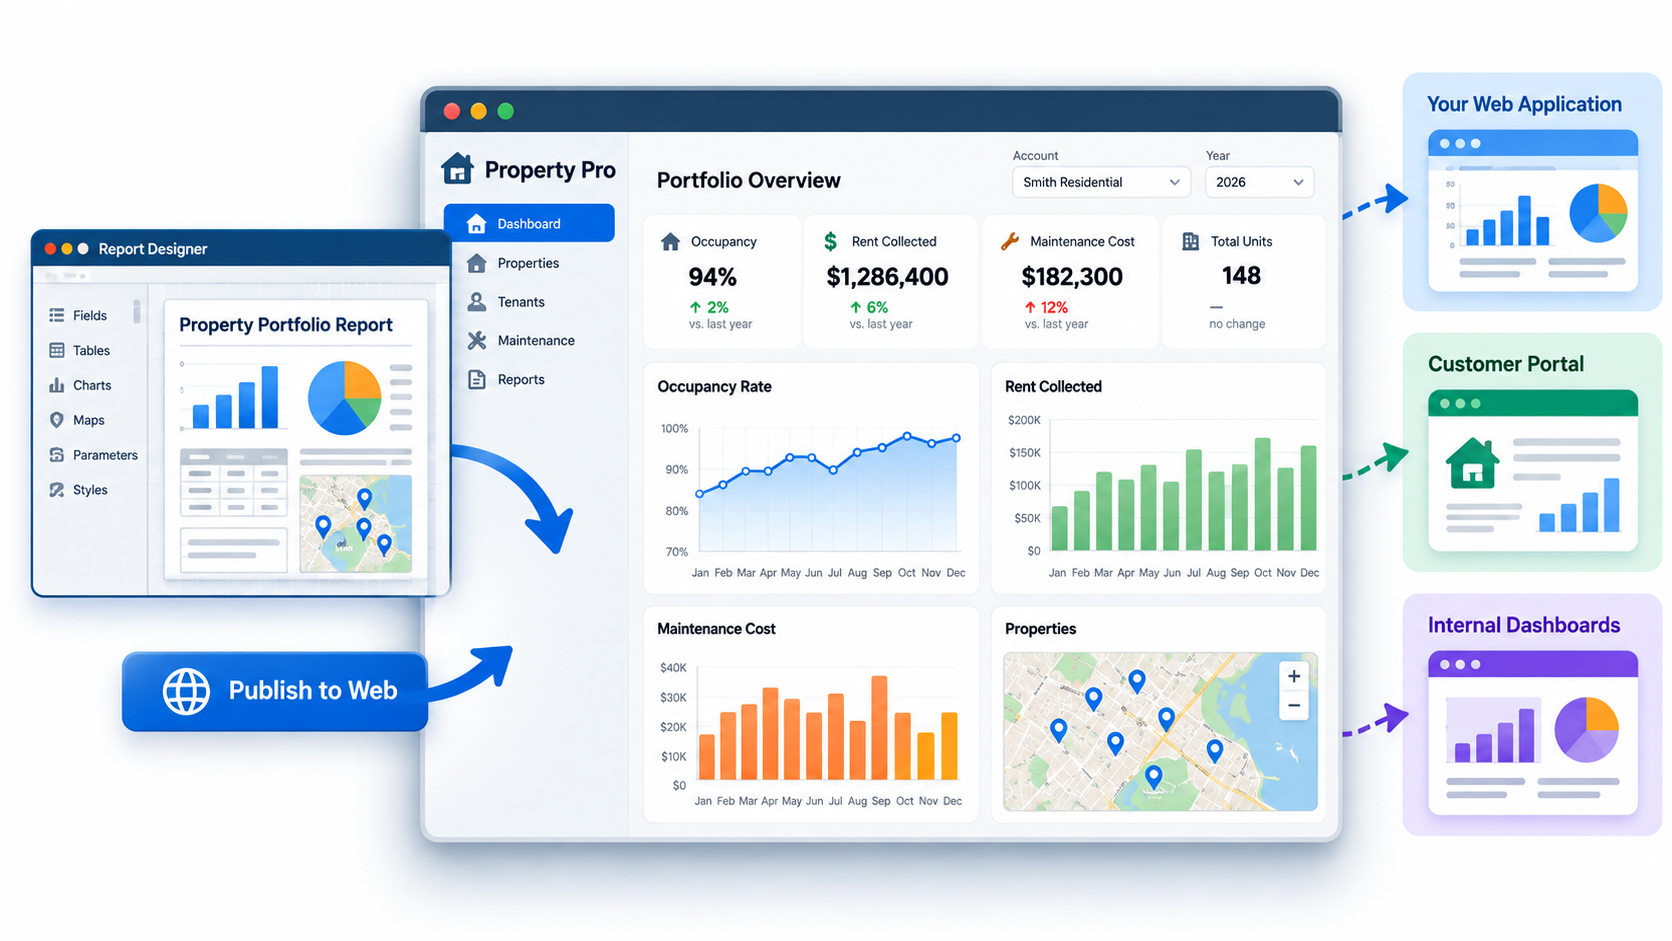
Turn reports into part of your application with secure, interactive embedded analytics. Publish dashboards, charts, maps, and reports directly into customer portals, internal applications, and other web experiences.
Explore Embedded Analytics arrow_forward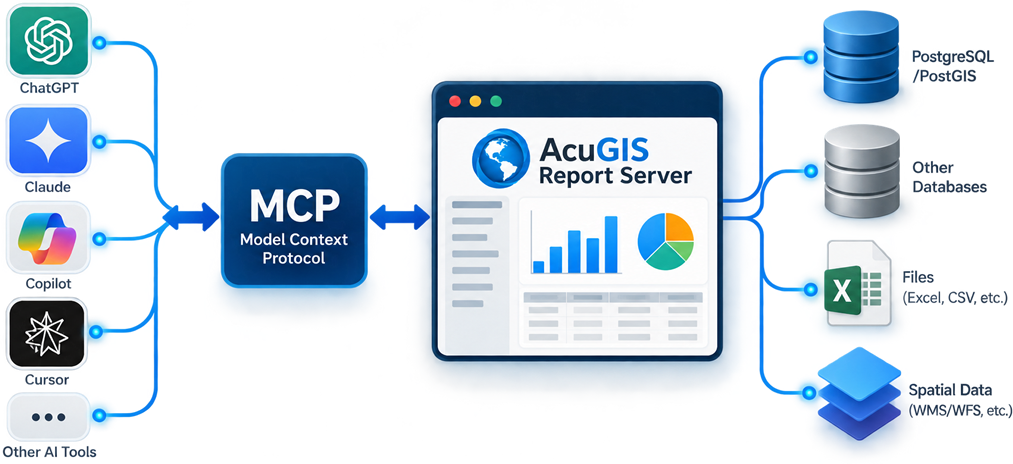
Connect your preferred AI tools and models directly to AcuGIS Report Server through the Model Context Protocol (MCP). Give AI governed access to your reporting data without exposing database credentials or allowing unrestricted SQL.
Explore MCP Server arrow_forward